Highlights
 Qatar
 South Sudan
Top 20 countries by energy use per capita
Energy Use per Capita by Country — full ranking
 Bahrain
 United Arab Emirates
 Kuwait
 Brunei
 Canada
 Saudi Arabia
 United States
 Oman
 Finland
 Russia
 South Korea
 Singapore
 Norway
 Turkmenistan
 Luxembourg
 Sweden
 Belgium
 Kazakhstan
 Curaçao
 Czechia
 Netherlands
 Iran
 Austria
 Gibraltar
 France
 Slovenia
 Slovakia
 Malaysia
 Japan
 Belarus
 China
 Germany
 Estonia
 Poland
 Bulgaria
 Lithuania
 Hungary
 Denmark
 Switzerland
 Israel
 Ireland
 Serbia
 Spain
 Latvia
 Croatia
 Italy
 Mongolia
 Bosnia and Herzegovina
 United Kingdom
 Gabon
 South Africa
 Turkey
 Greece
 Thailand
 Portugal
 Uruguay
 Argentina
 Azerbaijan
 Montenegro
 Suriname
 Cyprus
 Romania
 Mexico
 Georgia
 Hong Kong
 Brazil
 Ukraine
 Iraq
 Algeria
 North Macedonia
 Malta
 Uzbekistan
 Venezuela
 Armenia
 Moldova
 Equatorial Guinea
 Botswana
 Kosovo
 Mauritius
 Paraguay
 Costa Rica
 Panama
 Vietnam
 Dominican Republic
 Eswatini
 Indonesia
 Ecuador
 Guatemala
 Jamaica
 Egypt
 Tunisia
 Laos
 Bolivia
 Colombia
 Zambia
 El Salvador
 Lebanon
 Cuba
 Jordan
 India
 Namibia
 North Korea
 Nicaragua
 Morocco
 Honduras
 Kyrgyzstan
 Philippines
 Republic of the Congo
 Cambodia
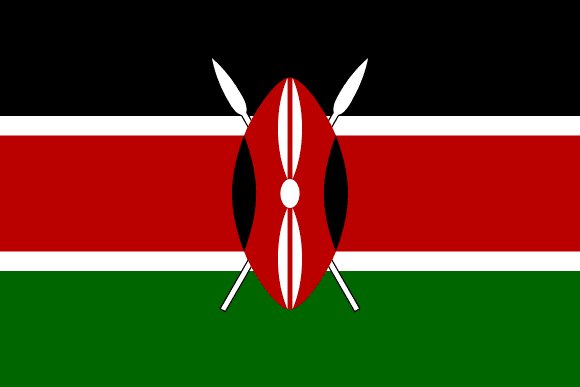 Kenya
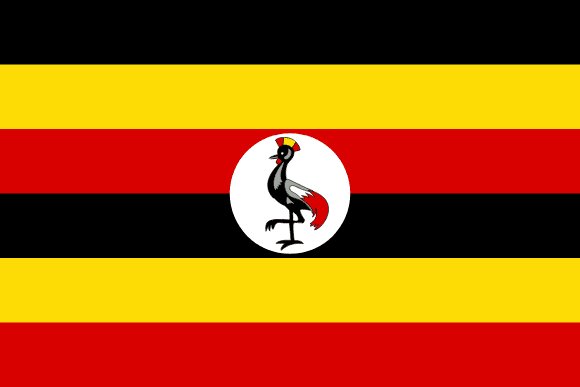 Uganda
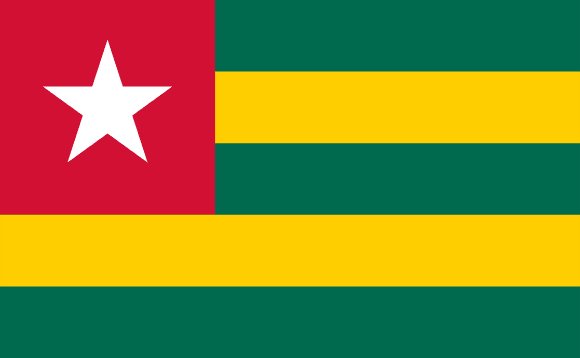 Togo
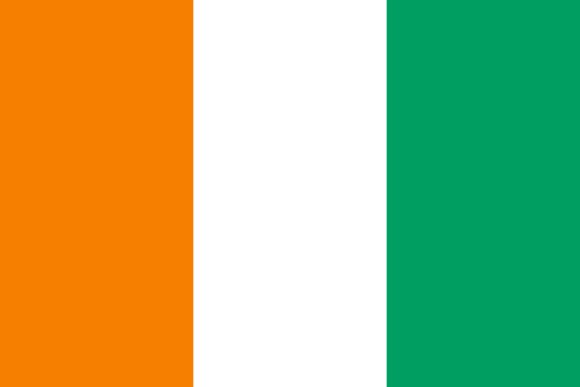 Ivory Coast
 Zimbabwe
 Sri Lanka
 Angola
 Nepal
 Pakistan
 Myanmar
 DR Congo
 Tanzania
 Syria
 Benin
 Tajikistan
 Ethiopia
 Sudan
 Rwanda
 Cameroon
 Ghana
 Mozambique
 Burkina Faso
 Nigeria
 Madagascar
 Eritrea
 Senegal
 Bangladesh
 Chad
 Niger
"10-yr change" compares the latest value with the value about ten years earlier (percentage change). Years in orange are older than 2018: the country has not reported recently, so its position may be out of date. Not ranked because their latest figure is older than 2012: Antigua and Barbuda (2007), Bahamas (2007), Barbados (2007), Belize (2007), Bhutan (2007), Cape Verde (2007), Comoros (2007), Djibouti (2007), Dominica (2007), Fiji (2007), Gambia (2007), Grenada (2007), Guinea-Bissau (2007), Guyana (2007), Kiribati (2007), Lesotho (2007), Maldives (2007), Marshall Islands (2007), Palau (1990), Saint Kitts and Nevis (2007), Saint Lucia (2007), Saint Vincent and the Grenadines (2007), Samoa (2007), São Tomé and Príncipe (2007), Seychelles (2007), Solomon Islands (2007), Timor-Leste (2007), Tonga (2007), Vanuatu (2007).
Energy use per capita by continent
| Continent | Countries | Highest | Lowest | Median |
|---|---|---|---|---|
| Asia | 44 | Qatar 16,343 |  Yemen 155 | 1,524 |
| Europe | 41 |  Iceland 15,997 |  Albania 889 | 2,514 |
| Africa | 37 |  Libya 2,662 | South Sudan 69 | 472 |
| North America | 15 |  Trinidad and Tobago 10,590 |  Haiti 324 | 1,012 |
| South America | 11 |  Chile 2,029 |  Peru 823 | 1,331 |
| Oceania | 2 |  Australia 4,751 |  New Zealand 3,557 | 4,154 |
Energy Use per Capita by Country: what the numbers say
The three highest countries are Qatar (16,343), Iceland (15,997), Trinidad and Tobago (10,590); the three lowest are South Sudan (69), Yemen (155), Niger (161).
The gap between the top and the bottom of the table is a factor of about 238. The median country sits at 1,505 and the simple average across all 150 countries is 2,249 — the average is pulled up by a few very large values.
Over roughly the last decade the biggest increases were in Laos (+97.4%), Cambodia (+64.3%), North Korea (+51.2%), while the largest decreases were in Curaçao (-68.8%), Venezuela (-47.4%), Yemen (-45%).
By continent, the leaders are Qatar in Asia (16,343), Iceland in Europe (15,997), Libya in Africa (2,662), Trinidad and Tobago in North America (10,590), Chile in South America (2,029), Australia in Oceania (4,751).
About this indicator
Energy use refers to the use of primary energy before transformation to other end-use fuels: indigenous production plus imports and stock changes, minus exports and fuels supplied to international ships and aircraft. It is expressed per person in kilograms of oil equivalent.
Source: World Bank Open Data (indicator EG.USE.PCAP.KG.OE). Countries without a published value are not ranked. Each country's own page shows the full historical series and its rank on this and every other indicator.
Frequently asked questions
Which country ranks first for energy use per capita?
Qatar ranks first with 16,343 kg of oil equivalent per person (2023, World Bank Open Data), followed by Iceland (15,997) and Trinidad and Tobago (10,590).
Which country has the lowest energy use per capita?
South Sudan is last of the 150 countries with current data, at 69 kg of oil equivalent per person; Yemen (155) and Niger (161) are just above it.
What is the world median energy use per capita?
The median across 150 countries is 1,505 kg of oil equivalent per person: half of all countries are above that value and half below. The unweighted average is 2,249.
Where does the data come from and how current is it?
From World Bank Open Data, indicator code EG.USE.PCAP.KG.OE. Each country shows its most recent available year (2014–2024); years older than 2018 are highlighted in orange because the country has not reported recently, and countries whose latest figure is older than 2012 are left out of the ranking altogether.
More rankings
Ranking generated 2026-10-19 from World Bank Open Data. Figures are the latest published values; live population figures are statistical extrapolations, not counts. More about our data.