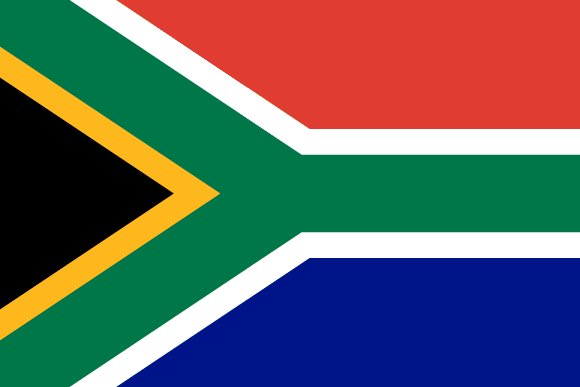
Administrative divisions of South Africa
South Africa is divided into 9 first-level administrative divisions:
Largest cities in South Africa
| # | City | Population |
|---|---|---|
| 1 | Johannesburg | 9,418,183 |
| 2 | Cape Town | 4,772,846 |
| 3 | Durban | 3,338,026 |
| 4 | PretoriaCapital | 2,112,693 |
| 5 | Soweto | 1,695,047 |
| 6 | Gqeberha | 1,050,078 |
| 7 | Soshanguve | 872,309 |
| 8 | Pietermaritzburg | 839,327 |
| 9 | Evaton | 725,468 |
| 10 | Benoni | 605,344 |
Johannesburg is the largest city in South Africa with about 9,418,183 people; the capital, Pretoria, has about 2,112,693. All 71 largest cities of South Africa →
Terrain, rivers & lakes
Highest terrain in South Africa: ≈ 3,465 m — read from the global elevation model, so summit heights are approximate. The physical map paints elevation bands from green lowlands to brown highlands.
🌊 Rivers
- Vaal
- Gamtoos
- Notwani
- Mogalakwena
- Orange
- Limpopo
- Marico
- Gamka
- Caledon
- Tugela
- Gourits
- Pongola
- Great Kei
- Olifants
- Molopo
- Auob
- Maputo
🏞️ Lakes
- Lake
- Bloemhof Dam
- Vaal Dam
- Vanderkloof Dam
- Gariep Dam
Ethnic groups in South Africa
Black African 80.9%, Colored 8.8%, White 7.8%, Indian/Asian 2.6% (2021 est.)
Regionally, Black African is the most common ethnic group across most of the 9 divisions, while Colored predominates in 1 division (Western Cape).
Source: CIA World Factbook (2021 est.) · regional dominance compiled by Glostats from censuses and surveys
Religions in South Africa
Christian 86%, ancestral, tribal, animist, or other traditional African religions 5.4%, Muslim 1.9%, other 1.5%, nothing in particular 5.2% (2015 est.)
Regionally, Christian is the most common religious group across most of the 9 divisions.
Source: CIA World Factbook (2015 est.) · regional dominance compiled by Glostats from censuses and surveys
Languages in South Africa
isiZulu or Zulu (official) 25.3%, isiXhosa or Xhosa (official) 14.8%, Afrikaans (official) 12.2%, Sepedi or Pedi (official) 10.1%, Setswana or Tswana (official) 9.1%, English (official) 8.1%, Sesotho or Sotho (official) 7.9%, Xitsonga or Tsonga (official) 3.6%, siSwati or Swati (official) 2.8%, Tshivenda or Venda (official) 2.5%, isiNdebele or Ndeb
Regionally, isiZulu or Zulu is the most common language group across most of the 9 divisions, while Afrikaans predominates in 2 divisions (Western Cape, Northern Cape); isiXhosa or Xhosa predominates in 1 division (Eastern Cape); Sesotho or Sotho predominates in 1 division (Free State); Setswana or Tswana predominates in 1 division (North West).
Source: CIA World Factbook (2018 est.) · regional dominance compiled by Glostats from censuses and surveys
Explore more
 Nigeria
 Ethiopia
 Egypt
 DR Congo
 Tanzania
 Kenya
 Sudan
 Uganda
Sources: boundaries, cities, rivers and lakes from Natural Earth (public domain, 1:10m); elevation from the AWS Open Data terrain tiles (SRTM/GMTED); ethnic, religious and language shares from the CIA World Factbook; regional dominance compiled by Glostats from national censuses and surveys. Page generated 2026-10-20. More about our data.