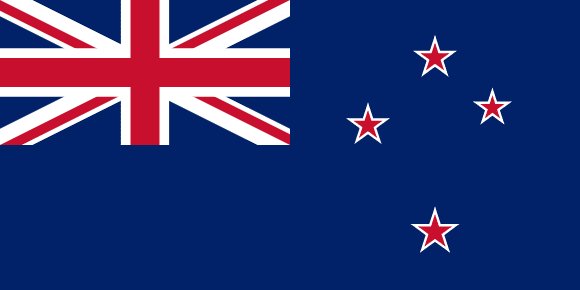
Administrative divisions of New Zealand
New Zealand is divided into 23 first-level administrative divisions:
Largest cities in New Zealand
| # | City | Population |
|---|---|---|
| 1 | Auckland | 1,377,200 |
| 2 | WellingtonCapital | 393,400 |
| 3 | Manukau | 375,600 |
| 4 | Christchurch | 363,200 |
| 5 | Waitakere | 208,100 |
| 6 | North Shore | 205,605 |
| 7 | Hamilton | 148,200 |
| 8 | Tauranga | 121,500 |
| 9 | Dunedin | 117,700 |
| 10 | Lower Hutt | 102,400 |
Auckland is the largest urban area in New Zealand with about 1,377,200 people; the capital, Wellington, has about 393,400.
Terrain, rivers & lakes
Highest terrain in New Zealand: ≈ 3,656 m — read from the global elevation model, so summit heights are approximate. The physical map paints elevation bands from green lowlands to brown highlands.
🌊 Rivers
- Hawea
- Kawarau
- Waiau
- Rangitaiki
- Mataura
- Clutha
- Whanganui
- Taieri
- Rangitikei
- Clarence
- Oreti
- Manawatu
- Buller
- Waihou
- Mohaka
- Wairau
- Whangaehu
- Waimakariri
- Mokau
- Ngaruroro
- Rakaia
- Hurunui
- Turakina
- Wairoa
- Awatere
- Grey
- Rangitata
- Tukituki
- Motueka
- Motueka Left Branch
- Motueka Right Branch
- Waitaki
- Patea
- Aparima
- Tutaekuri
- Whakatane
- Pomahaka
- Orari
- Karamea
- Ongarue
- Ahuriri
- Inangahua
- Waitoa
- Moawhango
- Piako
- Ruakituri
- Manganui
- Hutt
- Waikato
- Tongariro
- Pukaki
- Ohau
- Tekapo
🏞️ Lakes
- Lake Taupo
- Lake Tekapo
- Lake Ohau
- Lake Wakatipu
- Lake Pukaki
- Lake Manapouri
- Lake Te Anau
- Lake Wanaka
- Lake Hawea
- Lake Rotorua
- Lake Wairarapa
- Lake Benmore
- Lake Coleridge
- Lake Waikaremoana
- Lake Hauroko
- Lake Poteriteri
- Lake Monowai
- Lake Rotoroa
- Lake Rotoiti
- Lake Dunstan
Ethnic groups in New Zealand
European 64.1%, Maori 16.5%, Chinese 4.9%, Indian 4.7%, Samoan 3.9%, Tongan 1.8%, Cook Islands Maori 1.7%, English 1.5%, Filipino 1.5%, New Zealander 1%, other 13.7% (2018 est.)
Regionally, European is the most common ethnic group across most of the 23 divisions, while Maori predominates in 2 divisions (Gisborne District, Chatham Islands Territory).
Source: CIA World Factbook (2018 est.) · regional dominance compiled by Glostats from censuses and surveys
Religions in New Zealand
Christian 37.3% (Catholic 10.1%, Anglican 6.8%, Presbyterian and Congregational 5.2%, Pentecostal 1.8%, Methodist 1.6%, Church of Jesus Christ 1.2%, other 10.7%), Hindu 2.7%, Maori 1.3%, Muslim, 1.3%, Buddhist 1.1%, other religion 1.6% (includes Judaism, Spiritualism and New Age religions, Baha'i, Asian religions other than Buddhism), no religion 4
Regionally, no religion is the most common religious group across most of the 23 divisions.
Source: CIA World Factbook (2018 est.) · regional dominance compiled by Glostats from censuses and surveys
Languages in New Zealand
English (de facto official) 95.4%, Maori (de jure official) 4%, Samoan 2.2%, Northern Chinese 2%, Hindi 1.5%, French 1.2%, Yue 1.1%, New Zealand Sign Language (de jure official) 0.5%, other or not stated 17.2% (2018 est.)
Regionally, English is the most common language group across most of the 23 divisions.
Source: CIA World Factbook (2018 est.) · regional dominance compiled by Glostats from censuses and surveys
Explore more
 Australia
 Papua New Guinea
 Fiji
 Solomon Islands
 Vanuatu
 New Caledonia
 French Polynesia
 Samoa
Sources: boundaries, cities, rivers and lakes from Natural Earth (public domain, 1:10m); elevation from the AWS Open Data terrain tiles (SRTM/GMTED); ethnic, religious and language shares from the CIA World Factbook; regional dominance compiled by Glostats from national censuses and surveys. Page generated 2026-10-19. More about our data.