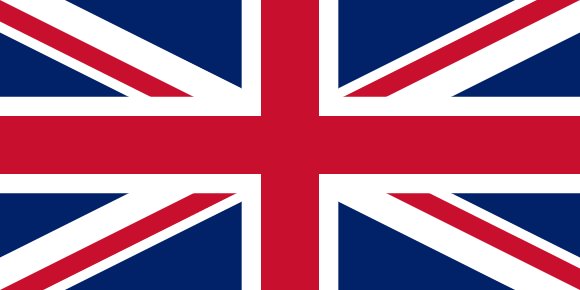
Flag of United Kingdom

United Kingdom Map & Atlas

Political, physical and population maps of the United Kingdom with its 232 first-level divisions, the capital London and largest cities, plus ethnic, religious and language maps.

Loading map…

Administrative divisions of United Kingdom

Natural Earth admin-1 boundaries · 232 units

The United Kingdom is divided into 232 first-level administrative divisions:

AberdeenAberdeenshireAngleseyAngusAntrimArdsArgyll and ButeArmaghBallymenaBallymoneyBanbridgeBarking and DagenhamBarnetBarnsleyBath and North East SomersetBedfordBelfastBexleyBirminghamBlackburn with DarwenBlackpoolBlaenau GwentBoltonBournemouthBracknell ForestBradfordBrentBridgendBrighton and HoveBristolBromleyBuckinghamshireBuryCaerphillyCalderdaleCambridgeshireCamdenCardiffCarmarthenshireCarrickfergusCastlereaghCentral BedfordshireCeredigionCheshire EastCheshire West and ChesterCityClackmannanshireColeraineConwyCornwallCoventryCraigavonCroydonCumbriaDarlingtonDenbighshireDerbyDerbyshireDerryDevonDoncasterDorsetDownDudleyDumfries and GallowayDundeeDungannonDurhamEalingEast AyrshireEast DunbartonshireEast LothianEast RenfrewshireEast Riding of YorkshireEast SussexEdinburghEilean SiarEnfieldEssexFalkirkFermanaghFifeFlintshireGatesheadGlasgowGloucestershireGreenwichGwyneddHackneyHaltonHaltonHammersmith and FulhamHampshireHaringeyHarrowHartlepoolHaveringHerefordshireHertfordshireHighlandHillingdonHounslowInverclydeIsle of WightIsles of ScillyIslingtonKensington and ChelseaKentKingston upon HullKingston upon ThamesKirkleesKnowsleyLambethLancashireLarneLeedsLeicesterLeicestershireLewishamLimavadyLincolnshireLisburnLiverpoolLutonMagherafeltManchesterMedwayMerseysideMerthyr TydfilMertonMid UlsterMiddlesbroughMidlothianMilton KeynesMonmouthshireMorayMoyleNeath Port TalbotNewcastle upon TyneNewhamNewportNewry and MourneNewtownabbeyNorfolkNorth AyshireNorth DownNorth East LincolnshireNorth LanarkshireNorth LincolnshireNorth SomersetNorth TynesideNorth YorkshireNorthamptonshireNorthumberlandNottinghamNottinghamshireOldhamOmaghOrkneyOxfordshirePembrokeshirePerthshire and KinrossPeterboroughPlymouthPoolePortsmouthPowysReadingRedbridgeRedcar and ClevelandRenfrewshireRhondda, Cynon, TaffRichmond upon ThamesRochdaleRotherhamRoyal Borough of Windsor and MaidenheadRutlandSalfordSandwellScottish BordersSeftonSheffieldShetland IslandsShropshireSloughSolihullSomersetSouth AyrshireSouth GloucestershireSouth LanarkshireSouth TynesideSouthamptonSouthend-on-SeaSouthwarkStaffordshireStirlingStockportStockton-on-TeesStoke-on-TrentStrabaneSuffolkSunderlandSurreySuttonSwanseaSwindonTamesideTelford and WrekinThurrockTorbayTorfaenTower HamletsTraffordVale of GlamorganWakefieldWalsallWaltham ForestWandsworthWarringtonWarwickshireWest BerkshireWest DunbartonshireWest LothianWest SussexWestminsterWiganWiltshireWokinghamWolverhamptonWorcestershireWrexhamYork

Largest cities in United Kingdom

Urban-area estimates · Natural Earth
#CityPopulation
1LondonCapital8,567,000
2Birmingham2,285,000
3Manchester2,230,000
4Leeds1,529,000
5Sheffield1,292,900
6Glasgow1,160,000
7Newcastle882,000
8Cardiff861,400
9Nottingham825,600
10Liverpool811,000

London is the largest urban area in the United Kingdom with about 8,567,000 people.

Terrain, rivers & lakes

Terrain tiles · Natural Earth rivers & lakes

Highest terrain in the United Kingdom: ≈ 3,628 m — read from the global elevation model, so summit heights are approximate. The physical map paints elevation bands from green lowlands to brown highlands.

🌊 Rivers

  • Thames
  • Ness
  • Oich
  • Trent
  • Severn
  • Caledonian Canal

🏞️ Lakes

  • Lough Neagh
  • Loch Ness
  • Loch Lochy
  • Upper Lough Erne

Ethnic groups in United Kingdom

CIA World Factbook · 2011
White
87.2%Black/African/Caribbean/black British
3%Asian/Asian British: Indian
2.3%Asian/Asian British: Pakistani
1.9%mixed
2%other
3.7%

White 87.2%, Black/African/Caribbean/black British 3%, Asian/Asian British: Indian 2.3%, Asian/Asian British: Pakistani 1.9%, mixed 2%, other 3.7% (2011 est.)

Regionally, White is the most common ethnic group across most of the 232 divisions.

Source: CIA World Factbook (2011 est.) · regional dominance compiled by Glostats from censuses and surveys

Religions in United Kingdom

CIA World Factbook · 2011
Christian
59.5%Muslim
4.4%Hindu
1.3%other
2%unspecified
7.2%none
25.7%

Christian (includes Anglican, Roman Catholic, Presbyterian, Methodist) 59.5%, Muslim 4.4%, Hindu 1.3%, other 2%, unspecified 7.2%, none 25.7% (2011 est.)

Regionally, Christian is the most common religious group across most of the 232 divisions, while none predominates in 38 divisions (Brighton and Hove, Bristol, Kingston upon Hull, Caerphilly, Blaenau Gwent, Rhondda, Cynon, Taff, …); Muslim predominates in 5 divisions (Tower Hamlets, Newham, Blackburn with Darwen, Luton, Redbridge).

Source: CIA World Factbook (2011 est.) · regional dominance compiled by Glostats from censuses and surveys

Languages in United Kingdom

CIA World Factbook

English

Regionally, English is the most common language group across most of the 232 divisions, while Welsh predominates in 2 divisions (Gwynedd, Anglesey); Scottish Gaelic predominates in 1 division (Eilean Siar).

Source: CIA World Factbook · regional dominance compiled by Glostats from censuses and surveys

Explore more
Every page leads somewhere new
More atlases in Europe

Sources: boundaries, cities, rivers and lakes from Natural Earth (public domain, 1:10m); elevation from the AWS Open Data terrain tiles (SRTM/GMTED); ethnic, religious and language shares from the CIA World Factbook; regional dominance compiled by Glostats from national censuses and surveys. Page generated 2026-10-19. More about our data.